Program to plot omicron triggers.
omicron-plot is a command line program to plot omicron triggers from trigger files.
How to run the program
The program must be given a minimum set of options:
omicron-plot channel=[channel name] gps-start=[GPS start] gps-end=[GPS end]
This command plots omicron triggers of a given channel between 2 GPS times. This command assumes that omicron trigger root files are saved in a standard place pointed by the environement variables $OMICRON_TRIGGERS and $OMICRON_TRIGGERS_ONLINE.
One can also plot triggers from a list of root files with:
omicron-plot file=[trigger file pattern] gps-start=[GPS start] gps-end=[GPS end]
where [trigger file pattern] can contain wild cards. For example: file="/path1/to/triggers/*.root /path2/to/triggers/*.root". This method is the correct way to access triggers that you generate yourself. It is bad practice to modify the default environement variables $OMICRON_TRIGGERS and $OMICRON_TRIGGERS_ONLINE.
Save and customize plots
Plots produced with omicron-plot can be saved in different formats, supported by the TPad::Print() function of ROOT. To select the format use the outformat="[FORMAT]" option.
In particular, plots can be customized intetractively with ROOT, e.g. for publication purposes. First, you have to save the plots in a root format with the outformat=root option:
omicron-plot channel=[channel name] gps-start=[GPS start] gps-end=[GPS end] outformat=root
You get root files which you can open with root. You can edit the style of the plots with the usual TStyle class of root.
Other options
The omicron-plot command comes with many additional options. Type omicron-plot to get the full list of options. In particular, triggers can be filtered in frequency, snr and so on.
cerr<<endl;
cerr<<"Usage:"<<endl;
cerr<<endl;
cerr<<"omicron-plot channel=[channel name] \\"<<endl;
cerr<<" file=[trigger file pattern] \\"<<endl;
cerr<<" gps-start=[GPS start] \\"<<endl;
cerr<<" gps-end=[GPS end] \\"<<endl;
cerr<<" segments=[segment file] \\"<<endl;
cerr<<" snr-thresholds=[list of SNR thresholds] \\"<<endl;
cerr<<" freq-min=[minimum frequency] \\"<<endl;
cerr<<" freq-max=[maximum frequency] \\"<<endl;
cerr<<" rate-min=[minimum rate] \\"<<endl;
cerr<<" rate-max=[maximum rate] \\"<<endl;
cerr<<" use-cluster=[cluster flag] \\"<<endl;
cerr<<" cluster-dt=[cluster time window] \\"<<endl;
cerr<<" use-date=[date flag] \\"<<endl;
cerr<<" outdir=[output directory] \\"<<endl;
cerr<<" outformat=[output file format] \\"<<endl;
cerr<<" file-prefix=[file prefix] \\"<<endl;
cerr<<" file-name=[file name] \\"<<endl;
cerr<<" style=[style] \\"<<endl;
cerr<<" drawtimeline=[GPS time] \\"<<endl;
cerr<<" plot-width=[plot width] \\"<<endl;
cerr<<" plot-height=[plot height]"<<endl;
cerr<<" plot-star=[plot star flag]"<<endl;
cerr<<endl;
cerr<<"[channel name] channel name used to retrieve centralized Omicron triggers"<<endl;
cerr<<"[trigger file pattern] file pattern to ROOT trigger files (GWOLLUM convention)"<<endl;
cerr<<"[GPS start] starting GPS time (integer only)"<<endl;
cerr<<"[GPS end] stopping GPS time (integer only)"<<endl;
cerr<<"[segment file] path to a file with a list of segments"<<endl;
cerr<<"[list of SNR thresholds] list of SNR thresholds. By default, snr-thresholds=\"5;8;10;20\""<<endl;
cerr<<"[minimum frequency] minimum trigger frequency value [Hz]"<<endl;
cerr<<"[maximum frequency] maximum triggerfrequency value [Hz]"<<endl;
cerr<<"[minimum rate] minimum rate value used to scale the rate plot [Hz]: use 0 for auto-scaling"<<endl;
cerr<<"[maximum rate] maximum rate value used to scale the rate plot [Hz]: use 0 for auto-scaling"<<endl;
cerr<<"[cluster tag] 1 = use clusters, 0 = use triggers. By default, use-cluster=1"<<endl;
cerr<<"[cluster time window] cluster time window [s]. By default, cluster-dt=0.1"<<endl;
cerr<<"[date tag] 1 = use date, 0 = use GPS time. By default, use-date=1"<<endl;
cerr<<"[output directory] output directory. By default, outdir=."<<endl;
cerr<<"[output file format] output file format. By default, outformat=png"<<endl;
cerr<<"[file prefix] file name prefix. By default, file-prefix=plot"<<endl;
cerr<<"[file name] file name. By default, file-name=default"<<endl;
cerr<<"[style] GWOLLUM-supported style. By default, style=STANDARD"<<endl;
cerr<<"[GPS time] GPS time at which drawing a vertical line (time plots only)"<<endl;
cerr<<"[plot width] plot width in pixels. By default, plot-width=850"<<endl;
cerr<<"[plot height] plot height in pixels. By default, plot-height=500"<<endl;
cerr<<"[plot star flag] plot a star on the loudest event (=1, default). =0: do not plot the star"<<endl;
cerr<<endl;
cerr<<"See also: https://virgo.docs.ligo.org/virgoapp/Omicron/omicron-plot_8cc.html#details"<<endl;
cerr<<endl;
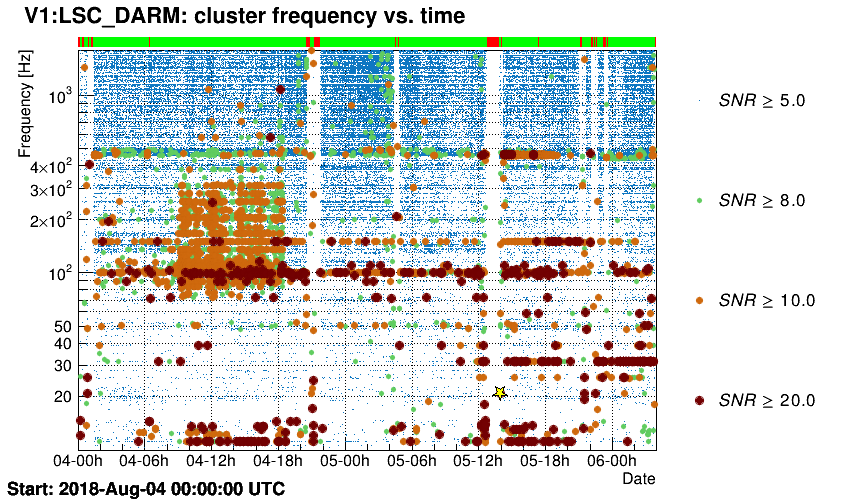
Triggers are plotted in the time-frequency plane.
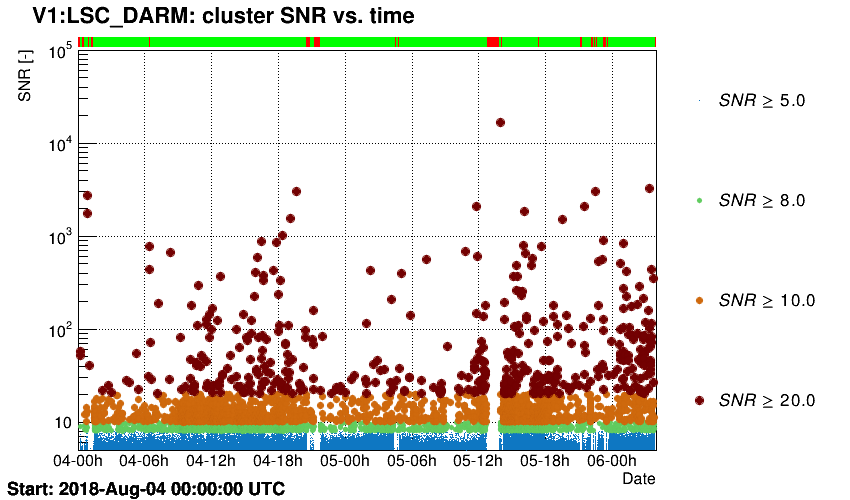
Triggers are plotted in the time-SNR plane.
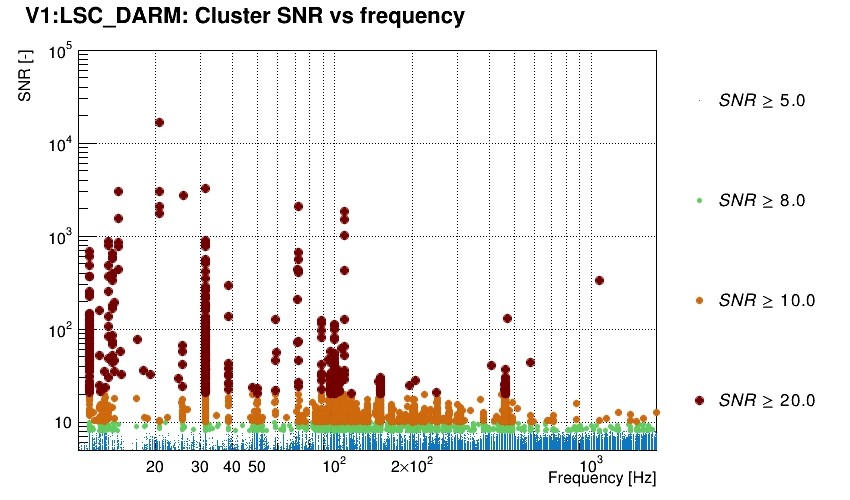
Triggers are plotted in the SNR-frequency plane.
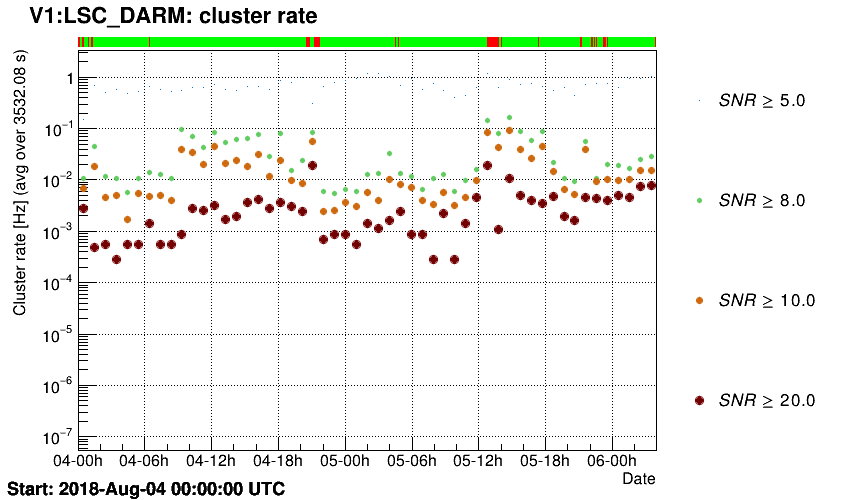
Trigger rates are plotted as a function of time.
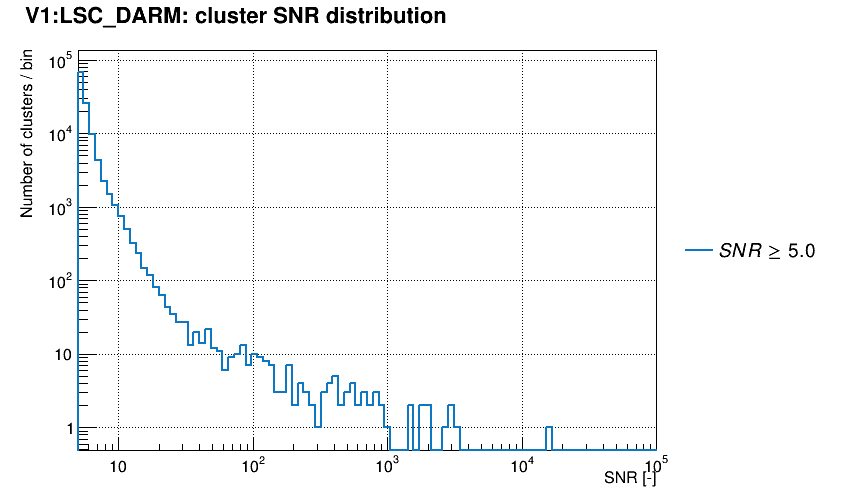
Trigger SNR distribution is plotted.
- Author
- Florent Robinet - florent.robinet@ijclab.in2p3.fr